

The Sunnyvale housing market remains highly competitive, with homes typically going to pending status quickly, reflecting strong buyer interest. As of mid-year 2026, the median listing price in Sunnyvale is about $1,499,888, while the median sold price is $1,800,000, illustrating that buyers frequently compete and pay above the listed amount when desirable homes hit the market. Sellers often receive offers at or slightly above asking prices, showing a favorable market for sellers. For buyers and sellers alike, understanding the nuances of this market in 2026 is the difference between a well-timed transaction and a costly misstep.
Key market metrics at a glance:
- Median listing price has declined year over year
- Median sold price remains strong, indicating resilient buyer demand
- Active listings have increased, offering more choices to buyers
- Homes sell relatively quickly with median days on market around three weeks
- Sellers are generally able to close near or above listing prices
- Median rent remains a key factor for rental market dynamics
Market snapshot: Homes go to pending in roughly 10 days, signaling a brisk pace even as listing prices have softened from their recent peaks.
Table of Contents
- How Sunnyvale real estate trends have shifted in 2026
- What migration patterns mean for Sunnyvale housing demand
- How Sunnyvale neighborhoods compare on price and rental rates
- How school quality shapes buyer decisions in Sunnyvale
- Climate risks and their effect on Sunnyvale property values
- Recent home sales data and market activity in Sunnyvale
- Local Realtor expert insights on navigating the Sunnyvale market in 2026
- Mortgage rates and the financing climate for Sunnyvale buyers
- How Sunnyvale compares to nearby Bay Area markets
- Who is buying and selling in Sunnyvale right now?
- New construction and development in Sunnyvale
- Key Takeaways
- Work with a Top 1% Sunnyvale Realtor
How Sunnyvale real estate trends have shifted in 2026
Price softening and inventory expansion are key trends shaping the Sunnyvale real estate market. Despite listing prices softening, well-priced homes continue to attract competitive offers and close above list. The gap between listing and sold prices reflects a market where sellers who price strategically continue to win, while overpriced listings sit longer.
| Metric | Current Value | 1-Year Change | 3-Year Change |
|---|---|---|---|
| Median listing price | $1,499,888 | about -11.77% | about -13% |
| Median sold price | $1,800,000 | about -2.44% | — |
| Price per sq ft | $970 | about -11% | about -11% |
| Active listings | 298 | +17.19% | — |
| Median days on market | 23 days | +9.52% | — |
| Median rent | $3,155/mo | — | — |
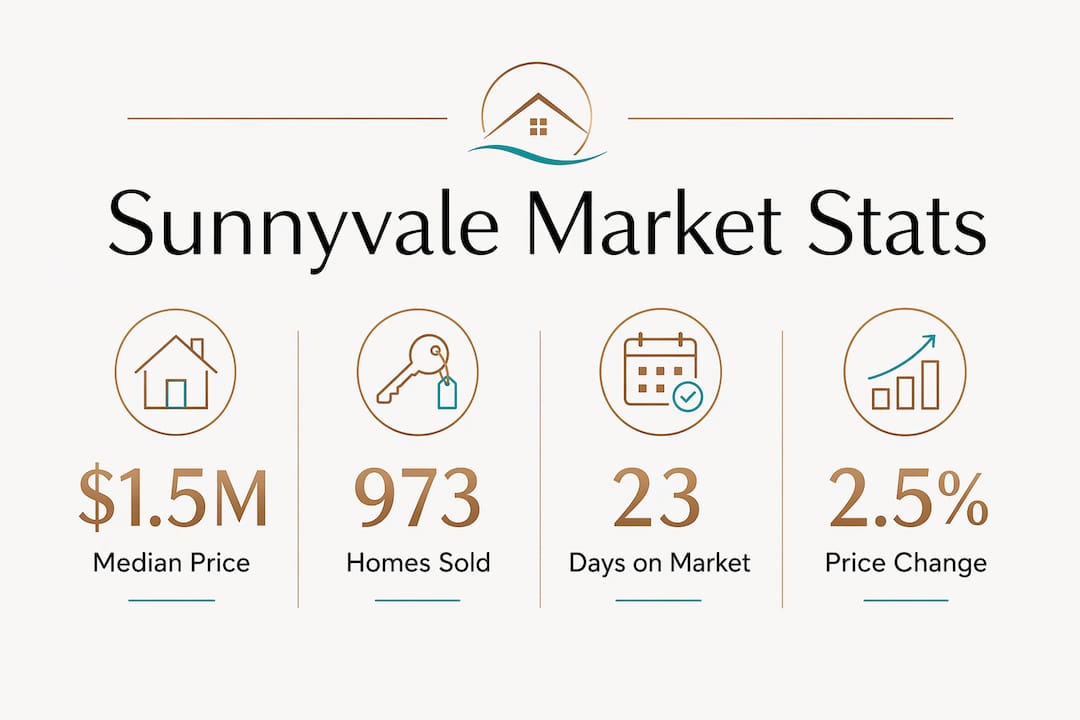
The price per square foot at $970 reflects Sunnyvale’s premium density, even after a year of softening. Three-year trends show that both listing prices and price per square foot have declined roughly 10–13%, which puts the current market in a more accessible position than the peak years without abandoning its premium character. Inventory growth over recent years has increased substantially, giving buyers more options than in prior years.
Key trend drivers shaping the 2026 market:
- Elevated mortgage rates have moderated buyer purchasing power, cooling the upper price tiers
- Tech sector employment remains the primary demand engine, sustaining competition for well-located homes
- Inventory growth is evident but remains modest in absolute terms for a city of Sunnyvale’s size.
- Sellers with high equity positions are choosing when to list rather than being forced to, which keeps distressed supply near zero
- Month-over-month listing counts rose 31%, suggesting a seasonal acceleration in early 2026 activity
What migration patterns mean for Sunnyvale housing demand
Tech employment is the single largest driver of relocation into Sunnyvale. Companies headquartered or with major campuses in and around the city continue to recruit nationally and internationally, drawing professionals who need to live within a reasonable commute. This sustained demand from tech employment keeps the buyer pool deep even when mortgage rates rise, because many buyers in this market are high-income earners with significant down payment capacity.
Migration impact: Demand from tech-sector relocations tends to be price-inelastic at the upper end of the market, which is one reason why sold prices have held closer to their peaks than listing prices suggest.
The outflow side of the equation matters too. Some long-term residents, particularly those approaching retirement, are choosing to sell and relocate to lower-cost metros, thereby freeing up inventory that would otherwise remain locked. This dynamic partially explains the 17.19% year-over-year increase in active listings.
Factors shaping relocation demand in Sunnyvale:
- Proximity to major tech employers in the South Bay and along the Highway 101 corridor
- Access to top-rated public schools, which draws families relocating from other states
- Quality of life factors including parks, walkability, and relatively lower crime rates compared to neighboring cities
- International buyer interest from tech workers on employment visas who plan long-term residency
- Cost-of-living pressures pushing some residents toward Sacramento, Austin, or Phoenix, which modestly eases competition at the entry price tier
How Sunnyvale neighborhoods compare on price and rental rates
The spread between Sunnyvale’s most and least expensive neighborhoods is wider than most buyers expect. De Anza commands a median listing price of $2,498,000 at $1,378 per square foot, while Morse Park sits at $1,378,000 at $840 per square foot. That gap of more than $1.1 million within the same city reflects how dramatically school proximity, lot size, and architectural character can shift value.
| Neighborhood | Median listing price | Price per sq ft | Median monthly rent |
|---|---|---|---|
| De Anza | $2,498,000 | $1,378 | Not publicly listed |
| Sunnyvale West | — | $1,378 | — |
| Ortega | — | — | Not publicly listed |
| East Sunnyvale | — | — | $3,155 |
| Ponderosa | — | — | — |
| East Murphy | — | — | $2,197 |
| Lakewood | $1,398,000 | $862 | $3,997 |
| Morse Park | $1,378,000 | $840 | Not publicly listed |
Sunnyvale West and De Anza represent the city’s premium tier, where custom architecture, larger lot sizes, and top school assignments combine to sustain prices well above the citywide median. Lakewood’s rental rate of $3,997 per month, despite a lower listing price, points to strong rental demand from tech workers who prefer that corridor’s commute access.
Neighborhood characteristics that drive value differences:
- School assignment zones for Cupertino Union School District and Fremont Union High School District add measurable premiums in western Sunnyvale
- Proximity to Caltrain stations lifts values in neighborhoods along the Murphy Avenue and Mathilda Avenue corridors
- Lot sizes in older western neighborhoods tend to be larger, supporting higher price-per-square-foot figures
- East Sunnyvale offers more accessible entry points while still delivering strong rental demand at $3,155 per month
- New mixed-use development near downtown Sunnyvale has increased walkability scores and attracted younger buyers to the SNAIL district
How school quality shapes buyer decisions in Sunnyvale
School district assignment is one of the most consistent value drivers in the Sunnyvale market. Buyers relocating from other states frequently identify school ratings on GreatSchools as their first filter before price, and local agents see this pattern play out in offer activity. Homes zoned for top-rated elementary schools in the Cupertino Union School District or Fremont Union High School District routinely attract more offers and shorter days on market than comparable homes in adjacent zones.
The relationship between school quality and home prices in the Bay Area is well-documented and particularly pronounced in Sunnyvale. Buyers with school-age children often stretch their budget to access a preferred zone, which compresses inventory and sustains prices even when the broader market softens.
School district factors influencing the Sunnyvale market:
- Cupertino Union School District covers much of western Sunnyvale and consistently earns high ratings, driving premiums in De Anza and Sunnyvale West
- Fremont Union High School District, which includes Homestead High School, adds a secondary premium layer for families with high school-age children
- Sunnyvale School District serves central and eastern portions of the city, with several highly rated elementary schools
- Santa Clara Unified School District covers portions of northern Sunnyvale near the 94054 zip code
- Buyers often pay $100,000 or more above comparable homes in adjacent zones to secure a preferred school assignment
Climate risks and their effect on Sunnyvale property values
Sunnyvale’s climate risk profile is relatively moderate compared to other California markets, but buyers and lenders are paying closer attention to it than they were five years ago. Flood risk data from First Street identifies specific parcels near the Guadalupe River corridor and low-lying areas of northern Sunnyvale as carrying elevated flood exposure. Fire risk in Sunnyvale is lower than in hillside communities like Saratoga or Los Gatos, but wildfire data still flags some eastern and northern edges of the city.
Insurance costs tied to climate risk have become a real factor in financing decisions. Buyers in flood-designated zones may face requirements for separate flood insurance policies, which adds to carrying costs and can affect how lenders calculate debt-to-income ratios. Some buyers are specifically requesting climate risk reports before making offers, a practice that was rare in Sunnyvale just three years ago.
Key climate considerations for Sunnyvale buyers and sellers:
- Flood risk is most concentrated near the Guadalupe River corridor and low-lying parcels in northern Sunnyvale
- Fire risk is relatively low within city limits but increases toward the foothills in adjacent communities
- Heat risk data from First Street shows Sunnyvale’s urban heat exposure is moderate, with newer construction better insulated against extreme heat events
- Properties in FEMA-designated flood zones may require additional insurance, affecting buyer affordability calculations
- Sellers in lower-risk zones can use favorable climate data as a marketing point, particularly with buyers coming from higher-risk California markets
Climate note: Sunnyvale’s overall risk profile remains well below that of many California coastal and hillside markets, which is one reason the city continues to attract buyers who have ruled out fire-prone communities.
Recent home sales data and market activity in Sunnyvale
Sunnyvale saw 973 residential properties sold in the past 12 months, with a median price for a single-family home of $1,800,000. The 104% sales-to-list price ratio confirms that the market, despite price softening at the listing level, still rewards sellers who price and present their homes well. Median days on market of 23 days is up 9.52% year over year but remains well below the national average, reflecting how quickly qualified buyers move when inventory is limited.
| Sales metric | Current figure | Year-over-year change |
|---|---|---|
| Homes sold (12 months) | 973 | Trending |
| Median sale price | $1,800,000 | about -2.44% |
| Median days on market | 23 days | +9.52% |
| Sales-to-list price ratio | 104% | Seller’s market |
| Active listings | 298 | +17.19% |
The absorption rate tells a clear story: 298 active listings against a pace of roughly 973 sales per year means the market carries less than four months of supply, well within seller’s market territory. Homes that are professionally staged, priced at or slightly below market, and marketed with high-quality photography tend to generate offer deadlines within the first week.
Key sales metrics buyers and sellers should track:
- The 104% sales-to-list ratio means the average accepted offer is 4% above the asking price
- Median days on market of 23 days reflects a warm market, per the Realtor Hotness Index classification
- Month-over-month, days on market rose 35.29%, suggesting some seasonal slowdown in early 2026
- Distressed sales account for just 0.04% of properties, keeping foreclosure pressure essentially nonexistent
- The gap between median listing price ($1,499,000) and median sold price ($1,800,000) reflects how strategic underpricing generates competitive offer situations
Find Out What Your Home Could Sell For →
Local Realtor expert insights on navigating the Sunnyvale market in 2026
The Sunnyvale market in 2026 rewards preparation more than it rewards speed. Buyers who arrive pre-approved, have done their neighborhood research, and understand the school zone implications of each address are the ones who close. Those who treat every offer as a learning experience tend to lose to buyers who treat every offer as a transaction they intend to win.
Inventory dynamics here are unlike most markets. Many Sunnyvale homeowners carry substantial equity and have no financial pressure to sell, which means the homes that do come to market often belong to sellers who have specific timing needs or are trading up within the area. Off-MLS opportunities and network-based sourcing matter more in this city than in most Bay Area submarkets. Working with a local Sunnyvale agent who has access to pre-market and pocket listings can make a material difference in a market where public inventory is this thin.
Pro Tip: In Sunnyvale, the best homes rarely sit long enough for a second showing. Submit your strongest offer the first time, with a clean contingency structure and a pre-approval letter from a lender who can close in 21 days or fewer.
Key Realtor recommendations for buyers and sellers in 2026:
- Sellers: price at or slightly below recent comparable sales to generate offer competition rather than chasing the market down with price reductions
- Buyers: get pre-approved with a local lender who understands Bay Area appraisal dynamics, not just a national online lender
- Both: pay close attention to school zone boundaries, which can shift property values by $100,000 or more within a single block
- Sellers: invest in pre-sale inspections and professional staging; the data consistently shows staged homes sell faster and closer to full value
- Buyers: consider homes that have been on market for 20 or more days, as sellers in that position are often more negotiable than the 104% average suggests
Mortgage rates and the financing climate for Sunnyvale buyers
Mortgage rates remain the most consequential external variable for Sunnyvale buyers in 2026. At prevailing 30-year fixed rates, a $1,800,000 purchase with 20% down carries a principal and interest payment that requires a household income well above $300,000 to qualify comfortably under standard debt-to-income guidelines. That threshold effectively filters the buyer pool to dual-income tech households, senior engineers, and executives, which is precisely the demographic that defines Sunnyvale’s demand base.

Jumbo loan products dominate this market. Most Sunnyvale purchases exceed the conforming loan limit, meaning buyers work with portfolio lenders, private banks, and credit unions rather than standard Fannie Mae or Freddie Mac products. Rates on jumbo loans have historically tracked slightly below conforming rates for well-qualified borrowers, which partially offsets the higher absolute loan amounts. Buyers with assets at a private bank often access relationship pricing that is not publicly advertised.
The financing climate also affects seller strategy. When rates rise, the pool of buyers who can qualify at a given price point shrinks, which is one reason listing prices have softened even as sold prices remain elevated. Sellers who understand this dynamic price to attract the widest qualified pool rather than anchoring to peak-year comparables.
How Sunnyvale compares to nearby Bay Area markets
Sunnyvale occupies a middle tier within the South Bay premium market. It is more accessible than Palo Alto or Los Altos, where median prices routinely exceed $3 million, but commands a significant premium over San Jose, where the citywide median runs well below $1.5 million. Cupertino, which shares school district boundaries with western Sunnyvale, trades at a comparable price level, with the Cupertino Union School District premium driving both markets similarly.
Santa Clara, directly adjacent to Sunnyvale, offers lower entry points with median listing prices below Sunnyvale’s citywide figure, making it an alternative for buyers who prioritize square footage over school zone. Fremont, further north in Alameda County, has attracted buyers priced out of Santa Clara County entirely, with Fremont’s 94539 zip code representing one of the Bay Area’s most competitive luxury submarkets outside of the Peninsula. For buyers considering the broader Bay Area, the Milpitas market offers another data point, with prices and school ratings that sit below Sunnyvale but above much of San Jose.
Sunnyvale’s 23-day median days on market compares favorably to slower Bay Area markets further from major tech campuses, confirming that proximity to employment centers remains the most durable value driver in the region.
Who is buying and selling in Sunnyvale right now?
The typical Sunnyvale buyer in 2026 is a dual-income tech household, often with one or both partners employed at a major Silicon Valley company, purchasing their first home after years of renting in the area. Many are in their mid-30s to mid-40s, have accumulated a down payment through equity compensation, and are motivated primarily by school access and commute proximity. International buyers, particularly from India and China, represent a meaningful share of the buyer pool, often purchasing with large down payments or all-cash offers.
Sellers tend to fall into two distinct profiles. The first is the long-term owner who bought before 2015, has substantial equity, and is either downsizing or relocating out of the Bay Area entirely. The second is the move-up buyer who purchased a smaller Sunnyvale home five to eight years ago and is now trading into a larger property within the same city or moving to Cupertino or Saratoga. Both seller profiles typically list with full marketing programs, understanding that presentation quality directly affects final sale price in this buyer demographic.
The investor presence in Sunnyvale is smaller than in many Bay Area cities. The high purchase prices relative to rental income make cap rates unattractive for traditional investment buyers, so the market is dominated by owner-occupants rather than institutional or individual investors.
New construction and development in Sunnyvale
New construction in Sunnyvale is concentrated in mixed-use and multifamily projects rather than single-family subdivisions, reflecting the city’s built-out character and its commitment to transit-oriented development near the downtown Caltrain station. The Murphy Avenue corridor and the area around Sunnyvale’s downtown have seen the most active development, with projects combining ground-floor retail with residential units above.
For buyers seeking new single-family construction, options within Sunnyvale’s city limits are limited. Most new detached homes are infill projects on lots where older structures have been demolished, often custom or semi-custom builds that command significant premiums over resale inventory. Buyers interested in new construction typically look at master-planned communities in neighboring cities or at townhome and condominium projects within Sunnyvale itself.
The city’s General Plan and housing element commitments under California’s state housing law have accelerated approval timelines for qualifying projects, which should add rental and for-sale inventory over the next three to five years. Buyers who want to track upcoming inventory can monitor the city’s planning commission agenda for project approvals that signal future supply additions.
Key Takeaways
The Sunnyvale housing market in 2026 favors sellers with homes selling quickly and many closing near or above listed prices, rewarding well-prepared buyers and strategic pricing.
| Point | Details |
|---|---|
| Median sold price | Homes close at $1,800,000 on average, well above the $1,499,888 median listing price. |
| Market pace | With a 10-day pending timeline and 23-day median days on market, well-priced homes move fast. |
| Inventory growth | Active listings rose 17.19% year over year to 298 homes, giving buyers more options than recent years. |
| Neighborhood spread | Prices range from $1,378,000 in Morse Park to $2,498,000 in De Anza, driven largely by school zones. |
| Seller advantage | A 104% sales-to-list ratio confirms sellers retain strong leverage when homes are priced and presented well. |
Work with a Top 1% Sunnyvale Realtor
Navigating the Sunnyvale market takes more than access to listings. It takes local expertise, negotiation experience, and a marketing approach calibrated to this specific buyer demographic. Laxmitoprealtor, Laxmi Penupothula, has closed more than $650 million in Bay Area transactions across 570+ deals, earning the SCCAOR REAL Award for Top 1% of Santa Clara County REALTORS® every year from 2021 through 2025. Her Sunnyvale real estate services include pre-sale inspections, professional staging, 3D Matterport tours, and a custom marketing strategy designed to maximize your final sale price. Whether you are buying your first Sunnyvale home or selling a property you have owned for decades, Laxmitoprealtor brings the precision and commitment that this market demands. Connect with Laxmi to discuss your goals and get a current market analysis specific to your neighborhood. Thinking about selling? Get a free, no-obligation home value estimate to see what your Sunnyvale property could sell for today.
Recommended
- Milpitas CA Real Estate Market Trends 2026 | Buyers & Sellers Guide – Laxmi Penupothula
- Bay Area Real Estate Market Insights 2026 – Laxmi Penupothula
- Top Real Estate Agent Cupertino CA | Laxmi Penupothula – Top 1% Realtor
- How to Price Your Home in San Jose CA for Maximum Sale Price

Laxmi Penupothula
RealTrends Verified Top 1% REALTOR® Nationwide (2021–2025) • CA DRE #02047105
SCCAOR Top 1% Santa Clara County • Intero Chairman Circle 2023–2025 • \$650M+ Closed • 570+ Transactions
Silicon Valley & Bay Area Specialist — Cupertino, San Jose, Fremont, Milpitas, Sunnyvale & surrounding cities.
Get a Free Home Valuation →