


A seller’s market means demand outpaces supply, so sellers set the terms and buyers compete on price and speed. A buyer’s market flips that: inventory outnumbers demand, and buyers gain room to negotiate on price, repairs, and closing terms. Check your local months’ supply first, then move to preapproval if you’re buying or a comparative market analysis if you’re selling.
TL;DR:
- A market with more than six months of supply generally favors buyers, while under four months indicates sellers have the advantage, but specific segments may differ.
- Rising price cuts, longer days on market, and a higher percentage of listings with reductions signal a market softening toward buyers earlier than median prices change.
- In a seller’s market, multiple offers and waived contingencies are common, whereas in a buyer’s market, sellers often resort to price corrections and concession offers.
- Local trends such as mortgage rate changes, job growth, and new construction influence market balance more than national headlines or overall metro data.
- Buyers should focus on getting preapproved, making clean offers, and understanding their true must-haves, while sellers benefit from accurate pricing, professional presentation, and targeted marketing.
Table of Contents
- Seller vs Buyer Market: Definitions and What They Actually Look Like
- How to Tell Which Market You’re In: The Indicators That Matter
- Buyer Tactics When You’re Outnumbered
- Seller Tactics When Buyers Have the Upper Hand
- Why Markets Shift: Rates, Jobs, and Supply
- What Local Track Records Actually Show
- The Playbook That Actually Works
- Get a Local Read Before You Price or Offer
- Where to Verify Market Data Yourself
- Sources
- FAQ
Seller vs Buyer Market: Definitions and What They Actually Look Like
The distinction comes down to leverage. In a seller’s market, homes sell fast, often above asking, because buyer demand exceeds the number of homes for sale. In a buyer’s market, the opposite is true: supply exceeds demand, prices soften, and homes sit longer. Investopedia’s definition frames this cleanly. Excess supply lowers prices and stretches out selling time, which is exactly what plays out on the ground.
You can see the mechanics in specific behaviors, not just abstract ratios:
- Multiple offers and waived contingencies signal a seller’s market. Buyers compete by dropping inspection requests or appraisal gaps.
- Price cuts after 30 to 60 days on market signal a buyer’s market. Sellers who priced too high have to correct course publicly.
- Seller concessions — covering closing costs, buying down a rate, offering a repair credit — show up almost exclusively when buyers hold leverage, according to Freddie Mac’s guidance on seller’s markets.
Property type and price tier complicate the picture. A metro can read as balanced overall while starter condos linger and luxury single-family homes still draw multiple offers. Always check the specific segment you’re buying or selling in, not just the metro headline.
How to Tell Which Market You’re In: The Indicators That Matter
Four numbers tell you almost everything. Here’s how to read them.
- Months’ supply. This measures how long it would take to sell every current listing at the recent sales pace. Realtor treats six months as the tipping point: above six months of supply usually means a buyer’s market, and under four months usually means sellers hold the advantage.
- Median days on market, tracked year over year. A metro where homes now sit 20 days longer than last year is drifting toward buyers, even if prices haven’t dropped yet.
- Percent of listings with price cuts. A rising share of price reductions is one of the earliest signals a market is softening, often ahead of the median-price data catching up.
- Pending-to-active ratio. More pending sales relative to active listings points to a tighter, seller-favoring market; a growing stack of unsold active listings points the other way.
Check these on Realtor.com’s Market Clock, Redfin’s local market pages, or your regional MLS’s public data feed.
Pro Tip: Don’t rely on a single month’s snapshot. A market can look balanced in isolation but be trending sharply in one direction. Pull three months of data before you draw a conclusion.
Buyer Tactics When You’re Outnumbered
Competing in a seller’s market means removing friction, not just raising your offer.
- Get preapproved, not just prequalified, and verify your lender through NMLS Consumer Access before you rely on their preapproval letter.
- Set a firm ceiling and your true must-haves before you tour anything. Bidding wars punish buyers who improvise.
- Submit clean offers: fewer contingencies, a reasonable appraisal gap commitment, and a closing timeline that matches the seller’s needs.
- Work with an agent who has access to off-market and pre-market inventory, and who can position a strong backup offer when the top bid falls through.
The strongest offer usually isn’t the highest number. It’s the cleanest one, with reliable financing and few ways to fall apart before closing, a point Freddie Mac makes explicit. Sellers weigh certainty as heavily as price. For a deeper walkthrough of how to structure a competitive bid, see making a competitive offer in the Bay Area.
Seller Tactics When Buyers Have the Upper Hand
Getting a good outcome in a buyer’s market comes down to four moves, in this order.
- Price to the comps, not to your hopes. Overpricing in a soft market invites the price-cut cycle that scares off serious buyers before they even schedule a tour.
- Invest in presentation. Professional staging, photography, 3D tours, and a pre-sale inspection consistently outperform market averages, even when overall demand is soft, according to industry practitioner data. See the home staging and prep guide for the specific steps that move the needle.
- Offer terms buyers actually value. A rate buy-down credit or a flexible closing date often closes a deal faster than a price cut of the same dollar amount.
- Market to the right buyer pool, not everyone. Targeted digital exposure and smart timing (avoiding a saturated listing week) beat a generic “just list it” approach.
If speed matters more than maximizing price, a quick-sale route is worth understanding as an alternative path, even if it isn’t right for every seller.
Why Markets Shift: Rates, Jobs, and Supply
Market balance isn’t fixed. It moves with a handful of forces:
- Mortgage rates change affordability instantly. A one-point rate jump can price out a chunk of buyers overnight, tilting a market toward buyers even if inventory hasn’t changed.
- Job growth and migration pull demand into specific metros or neighborhoods, sometimes overriding national trends entirely.
- New construction adds supply over time. Census housing starts data and NAHB construction cost surveys are the clearest early signal of where supply is about to loosen.
- Seasonality matters too. Listings typically spike in spring, which can look like a buyer’s market shift when it’s really just a calendar effect.
| Driver | Typical effect on market balance |
|---|---|
| Rising mortgage rates | Pushes toward buyer’s market (demand softens) |
| Strong local job growth | Pushes toward seller’s market (demand rises) |
| Rising new construction | Pushes toward buyer’s market over time (supply rises) |
| Spring listing surge | Temporary buyer’s market skew, often reverses by summer |
National headlines average all of this together, which is exactly why a “balanced national market” can mask a hot submarket a few miles from a cooling one.
What Local Track Records Actually Show
Rankings and awards only mean something when they translate into outcomes on specific streets. Over 8 years and 570+ closed transactions totaling more than $650 million, Laxmi Penupothula has been named RealTrends Verified Top 1% nationally for five straight years and earned the SCCAOR REAL Award for Santa Clara County’s top 1% every year from 2021 through 2025.
Two cases show these tactics working in real conditions: a Fremont sale that closed $250,000 over asking through positioning and multiple-offer strategy, and an Evergreen negotiation where concession structuring, not price alone, closed the deal. Before hiring anyone, ask a prospective agent for their recent sale-to-list ratio and their plan for your specific price tier, not just their overall market commentary.

The Playbook That Actually Works
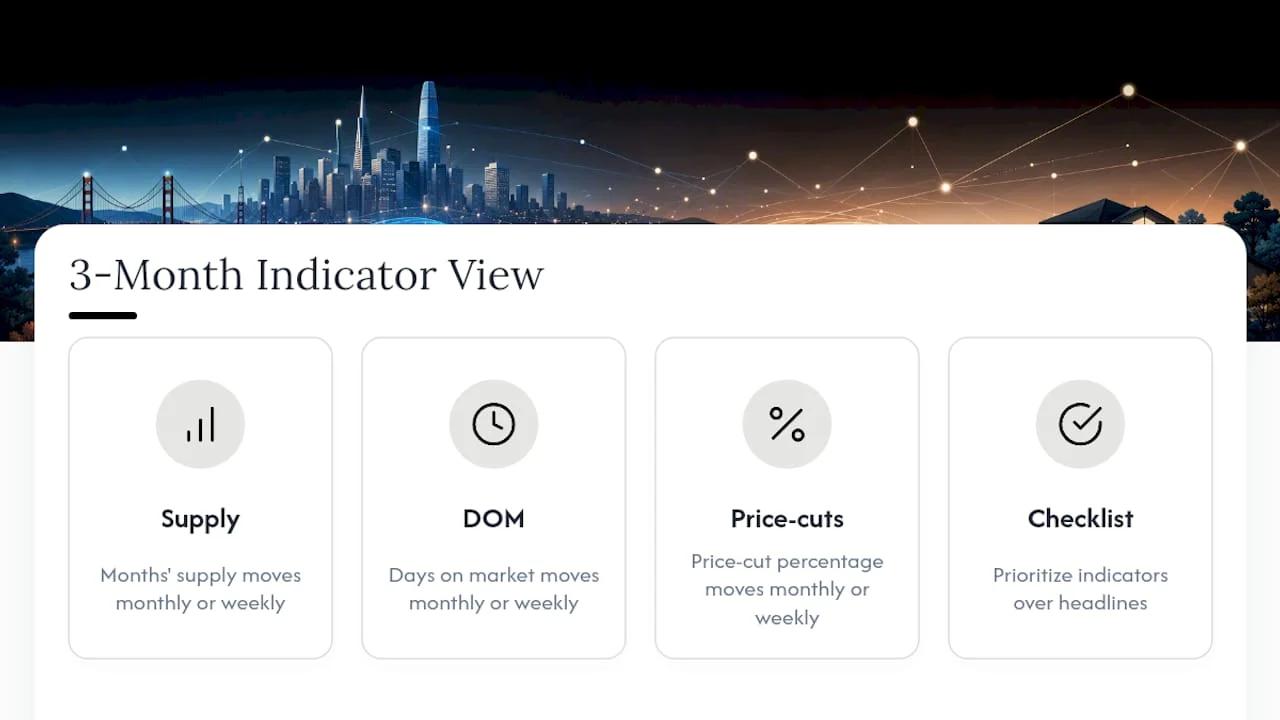
Most advice on this topic treats “seller’s market” and “buyer’s market” as static labels you check once and forget. That’s the wrong model. Months’ supply, days on market, and price-cut percentage move monthly, sometimes weekly during rate volatility, and a reader who checks once in January and acts in June is working off stale information.
The conventional advice also overweights the metro headline and underweights the submarket. I’d argue the price-tier and property-type breakdown matters more than the metro number in almost every Bay Area transaction I’ve seen analyzed. A “balanced” county can hide a starter-home segment still moving in eight days and a luxury segment sitting for ninety.
If you take one thing from this: prioritize the indicator checklist over the narrative. Rate headlines and news cycles lag reality by months. Months’ supply and price-cut percentage don’t.
— Mr
Get a Local Read Before You Price or Offer
National averages tell you almost nothing about what’s happening on your specific street or in your specific condo complex, which is exactly the gap a local realtor can close for Santa Clara County buyers and sellers. Rather than guessing from a headline, you get a price-tier and neighborhood-specific read on where your property or target home actually sits on the buyer-seller spectrum.

For sellers, that starts with a concierge process built around accurate pricing: marketing and presentation tailored to current buyer demand rather than last year’s comps. Request a free comparative market analysis to see where your home stands right now. For buyers, it means preapproval guidance and access to listings before they’re widely marketed. Explore the Bay Area buying guide and schedule a consultation to map out your next move in Cupertino, Sunnyvale, San Jose, Saratoga, Fremont, or Milpitas.
Where to Verify Market Data Yourself
Check Realtor.com’s Market Clock for months’ supply by metro, the NAR consumer guide for plain-language definitions, and Census housing starts data for supply-side construction trends.
Sources
- Is It a Seller’s Market? New Data Shows Where Sellers Still Lead
- What Is a Seller’s Market? – My Home by Freddie Mac
- Buyer’s market
FAQ
Are We in a Seller’s Market or Buyer’s Market Right Now?
It depends entirely on your metro and price tier. Check local months’ supply on Realtor.com’s Market Clock: above six months typically signals a buyer’s market, under four months typically signals a seller’s market.
What Is the 3-3-3 Rule in Real Estate?
Definitions of this rule vary across sources, so treat any specific version cautiously. It’s generally used as a rough buyer affordability guideline rather than a market-balance indicator, and it isn’t a standard this article’s data supports in detail.
Why Are Sellers Pulling Homes Off the Market?
Sellers typically delist when buyer demand softens faster than they expected, price cuts fail to attract offers, or they decide to wait for rates or seasonal demand to improve rather than sell at a discount.
How Does a Market Get Classified as Buyer’s or Seller’s?
Data platforms typically classify markets using months’ supply, median days on market, and price-cut share, with Realtor.com’s Market Clock plotting metros on a scale from peak seller advantage to peak buyer advantage.
How Can Sellers Compete Effectively in a Buyer’s Market?
Accurate pricing against real comps, professional staging and photography, and flexible terms like closing-date accommodation or rate buy-down credits are the levers sellers control regardless of overall demand.
Recommended
- Bay Area Real Estate Market Insights 2026
- Selling Home Mission District Fremont: The 2026 Seller’s Playbook
- Making a Competitive Offer in the Bay Area (Smart 2026)
- Bay Area Home Pricing with Multiple Offers: A Seller’s Strategy Guide

Laxmi Penupothula
Top 1% Realtor SCCAOR, RealTrends Verified (2021–2025) • CA DRE #02047105
SCCAOR Top 1% Santa Clara County • Intero Chairman Circle 2023–2025 • \$650M+ Closed • 570+ Transactions
Silicon Valley & Bay Area Specialist — Cupertino, San Jose, Fremont, Milpitas, Sunnyvale & surrounding cities.
Get a Free Home Valuation →