


The Santa Clara County housing market enters mid-2026 as a firm seller’s market, with limited inventory sustaining pricing power even as some softening has emerged. The median list price sits at $1,848,950 as of July 2026, while the average home value has edged down 1.6% year-over-year to $1,647,224. Active listings total approximately 1,085 county-wide, a slight decrease from prior months.
Key indicators at a glance:
- Market Action Index: ~53, firmly in seller’s market territory
- Active listings: ~1,085 county-wide (down month-over-month)
- Median list price: $1,848,950 (July 2026)
- Average home value: $1,647,224 (down 1.6% year-over-year)
- Days on market: 37 days in San Jose (up 9% year-over-year)
- Price reductions: 16.5% of San Jose listings show price reductions, which is below the national average of 18.8%.
The city of Santa Clara itself tells a notably different story, with median listing prices rising year-over-year and homes selling above asking price in June 2026.
Table of Contents
- How mortgage rates and supply dynamics are shaping buyer behavior
- What the price forecast looks like for the next 18–30 months
- Local expertise on buying or selling in Santa Clara County in 2026
- Why experienced local representation matters in this market
- How prices and demand vary by neighborhood
- New construction and housing development activity
- How the local economy and tech employment drive housing demand
- How Santa Clara County’s market cycles compare historically
- Government policies and zoning laws affecting the housing market
- Laxmitoprealtor: your local advantage in a complex market
- Key Takeaways
How mortgage rates and supply dynamics are shaping buyer behavior
Elevated mortgage rates have meaningfully reduced purchasing power for buyers across Silicon Valley. Households that could comfortably qualify for a $1.5 million home two years ago now face significantly higher monthly payments on the same property, pushing some to delay purchases or remain renters.
The structural “lock-in effect” compounds this pressure on supply. Homeowners who secured pandemic-era rates have little financial incentive to sell and take on a new mortgage at today’s rates. That reluctance keeps turnover low, which in turn prevents meaningful inventory growth even as buyer demand cools. New listings in San Jose have declined year-over-year, reflecting this dynamic.
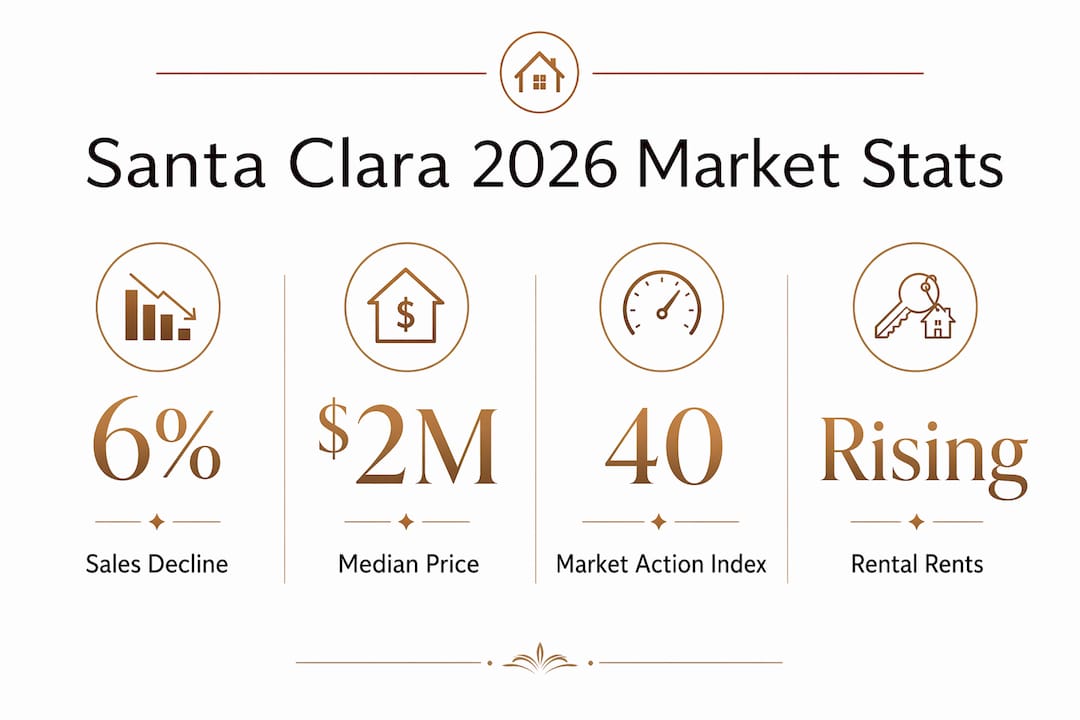
The Market Action Index is a real-time gauge combining sales velocity and available inventory to determine whether conditions favor buyers or sellers. Readings above 30 indicate a seller’s market; Santa Clara County’s reading near 53 signals that supply constraints are offsetting slower buyer demand.
- Above 60: Extreme seller’s market, multiple offers common
- 30–60: Seller’s market, pricing power intact
- Below 30: Buyer’s market, negotiating leverage shifts
Pro Tip: If the Market Action Index in your target neighborhood drops below 40, that is your signal to negotiate more aggressively on price or contingencies. Watch it monthly, not just at offer time.
Sales volume across the county declined somewhat year-over-year as affordability challenges keep cautious buyers on the sidelines. Homes are still selling, but the pace has moderated.
What the price forecast looks like for the next 18–30 months
Expert projections point to moderate price adjustments rather than a sharp correction. The most credible medium-term outlook anticipates moderate price declines from peak values depending on price tier, with larger adjustments expected in higher-priced segments and the adjustment period extending toward 2028.
“Price adjustments in Santa Clara County are expected to be moderate compared to the national average, with forecasts indicating a 15% to 30% drop depending on price tier over the deeper market recession period ending around 2028.” — firsttuesday Journal
Several factors will shape how that range plays out:
- Inventory release: If mortgage rates fall meaningfully, locked-in sellers may list, adding supply and moderating prices further.
- Employment stability: Tech sector layoffs or expansions directly affect buyer confidence and purchasing capacity in this market.
- Rental economics: Average rents in the county run at levels that make ownership still attractive for long-term holders despite higher carrying costs.
- Rate trajectory: Any sustained decline in mortgage rates would quickly reignite demand and compress the adjustment timeline.
- Price tier sensitivity: Entry-level and mid-range properties tend to hold value better than luxury-tier homes during corrections.
The rental market reinforces the complexity. With rents rising and rental inventory tightening, many buyers find renting more cost-effective in the short term, sustaining rental demand and keeping some potential buyers out of the purchase market longer than they might otherwise stay.
Local expertise on buying or selling in Santa Clara County in 2026
Navigating this market confidently requires more than data. It requires someone who has closed transactions in every phase of the Silicon Valley cycle. Laxmi Penupothula, REALTOR®, brings eight years of Bay Area experience, $650M+ in closed sales, and 570+ transactions to every client engagement. She has earned the SCCAOR REAL Award for Top 1% of Santa Clara County Association of REALTORS® members by sales volume every year from 2021 through 2025, and RealTrends Verified has independently ranked her in the Top 1% of agents nationally for five consecutive years.
“Locally priced homes that are well marketed and competitively priced often receive multiple offers and can sell above listing price, despite overall market slowing — national trends do not directly apply here.” — Realtor.com
That insight captures exactly what separates a well-executed listing from one that lingers. A home sold $200K over asking in San Jose illustrates what strategic pricing and full-service marketing can deliver even in a moderating market.
Pro Tip: In 2026, pricing from day one matters more than ever. Overpriced listings accumulate days on market, and buyers notice. A precise opening price, backed by current comparable sales, generates urgency that a price reduction never recovers.
For sellers, Laxmi’s concierge approach covers pre-sale inspections, professional staging, photography, videography, 3D Matterport tours, and a custom marketing plan built around your specific property. For buyers, her negotiation experience and local market knowledge in Cupertino and across the county translate directly into better terms and fewer surprises.
Why experienced local representation matters in this market
The 2026 Santa Clara County market rewards preparation and penalizes guesswork. Working with a verified top-tier local REALTOR® is not a luxury in this environment; it is a practical advantage with measurable impact on your outcome.
- Verified credentials: RealTrends Top 1% nationally (2021–2025); SCCAOR REAL Award Top 1% locally (2021–2025)
- Transaction depth: 570+ closed transactions across Cupertino, Sunnyvale, San Jose, Saratoga, Fremont, Milpitas, and the greater South Bay
- Concierge seller services: Staging, professional photography, Matterport tours, 2D floor plans, and targeted digital marketing
- Negotiation precision: IT consulting background translates into analytical, disciplined offer strategy
- Proven results: Consistent sale prices above market average, including multiple cases of $80K–$250K over asking
How prices and demand vary by neighborhood
Santa Clara County is not one market. It is dozens of micro-markets, each with its own supply, demand, and pricing rhythm.
Within San Jose, Almaden Valley carries a median listing price of $2,098,000, while Downtown San Jose sits at $925,000. Willow Glen, one of the most popular neighborhoods for households, lists at a median of $1,699,000 with homes selling in a competitive environment. The Silver Creek area commands premium pricing for its luxury inventory and nearby schools. Cambrian-Pioneer, at a median of $1,748,000, has seen listing counts rise 34.75% year-over-year, suggesting growing seller activity.
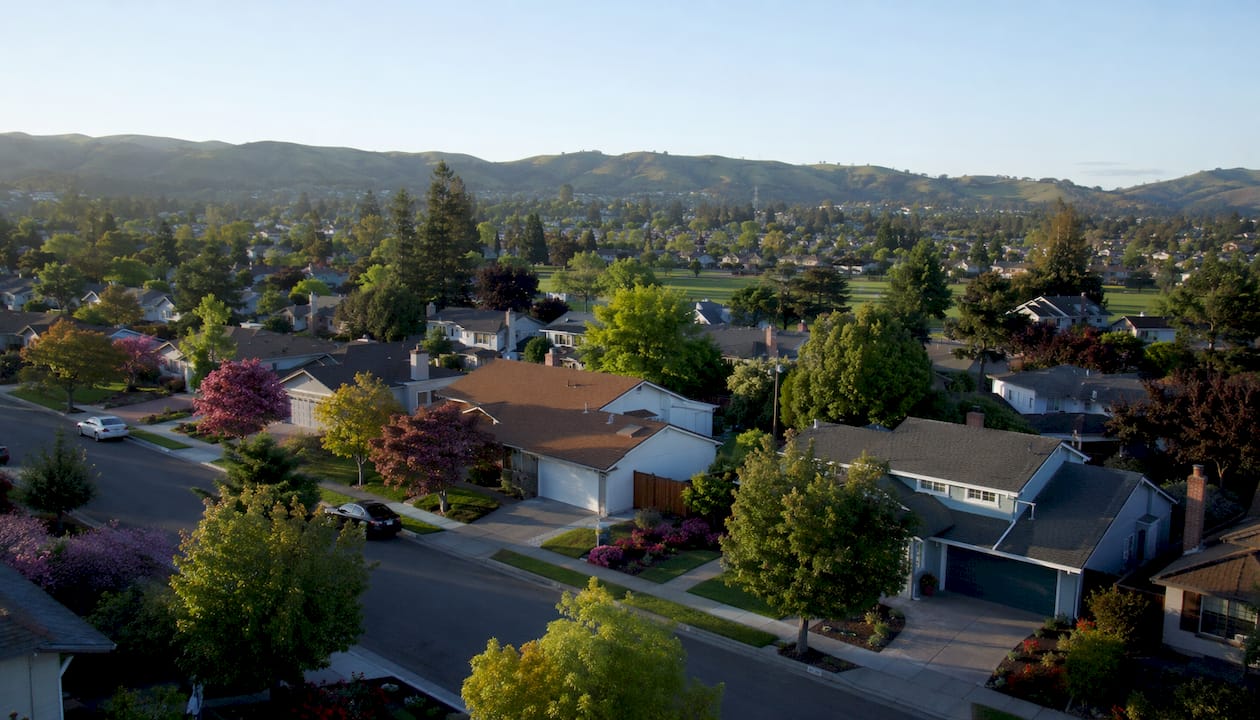
The city of Santa Clara itself shows strong appreciation, with the Santa Clara Southwest neighborhood listing at $2,198,000 and the Raynor neighborhood reaching $2,495,000. School district quality, commute access to major tech campuses, and lot size all drive meaningful price premiums within the county. Understanding how school districts affect home value is particularly relevant for households evaluating neighborhoods.
New construction and housing development activity
New housing development in Santa Clara County remains constrained by land scarcity, high construction costs, and a lengthy permitting process. The county’s built-out geography limits large-scale greenfield development, so most new supply comes from infill projects, mixed-use developments near transit corridors, and accessory dwelling unit construction.
The City of San José has prioritized higher-density development near BART and VTA light rail stations under its General Plan, but actual unit delivery lags behind targets. Construction costs in the Bay Area remain among the highest in the nation, which limits the financial viability of projects at price points accessible to middle-income buyers. The practical result: new supply is not arriving fast enough to meaningfully shift the supply-demand balance in the near term.
How the local economy and tech employment drive housing demand
Santa Clara County’s housing market is inseparable from its technology economy. Apple, Google, Nvidia, Intel, and dozens of high-growth companies headquartered or operating here generate the high-income employment base that sustains demand for premium residential properties. When tech hiring accelerates, housing demand follows quickly. When layoffs occur, buyer confidence softens and some discretionary purchases are delayed.
The 2024–2025 period saw notable tech sector workforce reductions, contributing to the 6% decline in sales volume. Yet the county’s unemployment rate remains well below national averages, and compensation levels for retained employees continue to support prices at the upper end of the market. The Bay Area real estate market remains fundamentally tied to the health of this employment base.
How Santa Clara County’s market cycles compare historically
Santa Clara County has experienced three significant correction cycles in the past three decades: the dot-com bust of 2001–2003, the financial crisis of 2008–2011, and the post-pandemic normalization beginning in 2022. Each cycle shared common features: rapid appreciation driven by economic expansion, followed by a demand shock, inventory adjustment, and eventual recovery.
The current period most closely resembles the 2006–2008 pre-correction phase, with affordability stretched by rate increases rather than loose lending standards. Critically, the county recovered faster than most U.S. markets in prior cycles because its employment base and land constraints reasserted themselves. The firsttuesday Journal’s forecast of a moderate correction through approximately 2028 aligns with this historical pattern, suggesting a recovery phase could begin as early as 2028–2029 if rates normalize.
Government policies and zoning laws affecting the housing market
California’s housing policy environment has shifted meaningfully in recent years. Senate Bill 9 (SB 9) allows most single-family parcels in urban areas to be split into two lots and permits duplexes on each, theoretically doubling density on millions of parcels statewide. Adoption has been slower than proponents hoped, partly due to local permitting friction and construction economics.
Accessory dwelling unit legislation has had more tangible impact. ADU construction in San José and surrounding cities has increased meaningfully, adding rental supply and giving homeowners a path to offset mortgage costs. Inclusionary zoning requirements in many Santa Clara County cities mandate that a percentage of new units in larger developments be priced at below-market rates, which affects developer feasibility calculations and ultimately the pace of new supply.
Proposition 19, passed in 2020, changed property tax transfer rules in ways that reduced the incentive for long-term homeowners to sell, reinforcing the lock-in effect alongside the mortgage rate dynamic.
Laxmitoprealtor: your local advantage in a complex market

Sellers in Santa Clara County who work with Laxmitoprealtor gain access to a proven, full-service approach that has delivered results above asking price across dozens of transactions in this exact market. The Almaden case study shows what a precisely priced, expertly marketed listing can achieve even when broader conditions are moderating. Laxmi’s concierge process covers every detail from pre-sale preparation through final negotiation, so you are never leaving value on the table.
For buyers, the same analytical discipline that built a $650M+ transaction record translates into sharper offer strategy, better due diligence, and fewer costly surprises. Whether you are buying your first Silicon Valley home or selling a long-held property, Laxmitoprealtor brings the verified credentials, local depth, and personalized attention that this market demands.
Connect with Laxmi to discuss your specific situation and get a current market analysis tailored to your neighborhood.
Key Takeaways
The Santa Clara County housing market in 2026 remains a seller’s market driven by structural supply constraints, with moderate price adjustments expected through 2028 before a likely recovery phase.
| Point | Details |
|---|---|
| Seller’s market confirmed | The Market Action Index near 53 confirms sellers retain pricing power despite slower buyer activity. |
| Prices softening modestly | Average home values are down 1.6% year-over-year to $1,647,224, with forecasts indicating a moderate 15%–30% price adjustment by tier through 2028. |
| Supply stays tight | Only ~1,085 active listings county-wide; new San Jose listings declined year-over-year. |
| Neighborhood variation is wide | Almaden Valley lists at $2,098,000 while Downtown San Jose sits at $925,000, requiring hyper-local analysis. |
| Laxmitoprealtor’s track record | Top 1% nationally and locally for five consecutive years, with $650M+ in closed sales across 570+ transactions. |
Recommended
- Silver Creek San Jose Luxury Homes for Sale | 2026 Prices & Guide
- Bay Area Real Estate Market Insights 2026 – Laxmi Penupothula
- Milpitas CA Real Estate Market Trends 2026 | Buyers & Sellers Guide – Laxmi Penupothula
- Selling Home Mission District Fremont: The 2026 Seller’s Playbook

Laxmi Penupothula
Top 1% Realtor SCCAOR, RealTrends Verified (2021–2025) • CA DRE #02047105
SCCAOR Top 1% Santa Clara County • Intero Chairman Circle 2023–2025 • \$650M+ Closed • 570+ Transactions
Silicon Valley & Bay Area Specialist — Cupertino, San Jose, Fremont, Milpitas, Sunnyvale & surrounding cities.
Get a Free Home Valuation →