


Thirty-year fixed mortgage rates will most likely hold in the mid-6% range for most of 2026, according to both Fannie Mae’s projection of roughly 6.4% and the MBA’s forecast near 6.5%. Both institutions push meaningful relief into 2027. Expect small dips, not a return to 5% territory, unless the economy takes an unexpected turn.
TL;DR:
- Mortgage rates are projected to stay in the mid-6% range for most of 2026, with only small dips expected and no return to sub-5% levels unless the economy changes unexpectedly.
- Current rates hover around 6.65% for 30-year fixed mortgages, with fluctuations caused by inflation data, employment reports, and geopolitical events affecting Treasury yields.
- The consensus forecast places the average 30-year fixed rate in 2026 between 6.1% and 6.5%, with no major move below 6% anticipated before 2027.
- Mortgage rates are more closely tied to the 10-year Treasury yield and inflation expectations than to Federal Reserve policy directly, with inflation reports often driving sudden swings.
- Buyers should plan around a mid-6% rate, lock their rate before closing, compare quotes within a short window, and focus on local market conditions rather than waiting for a significant rate drop.
Table of Contents
- Mortgage Rate Forecast 2026: Where Rates Stand Right Now
- What Fannie Mae, MBA, and Freddie Mac Project for 2026
- What Actually Moves Mortgage Rates
- Baseline, Best-Case, and Worst-Case Scenarios for 2026
- What This Means If You’re Buying or Refinancing
- Your Mortgage Rate Action Checklist for 2026
- How This Plays Out Across Santa Clara County
- Primary Sources to Track Through 2026
- Ready to Turn This Forecast Into a Plan?
- The Editorial Take: Stop Waiting for a Number That Isn’t Coming
- Sources
Mortgage Rate Forecast 2026: Where Rates Stand Right Now
Any mortgage rate forecast 2026 buyers rely on has to start with where things actually sit today, not where anyone hopes they’ll land. Freddie Mac’s Primary Mortgage Market Survey put the 30-year fixed average at roughly 6.65% for the week of August 20, 2026, with the 15-year fixed running about three-quarters of a point lower. That’s the benchmark most lenders quote against, though your actual offer will vary based on credit score, loan size, and down payment.
The last quarter has been choppier than the headline average suggests. Rates ticked down slightly over the summer as inflation data came in cooler than feared, then bounced back up on stronger jobs numbers and a bond market spooked by fresh geopolitical headlines. None of this has broken the pattern, though. Rates have essentially traded in a narrow band for months rather than trending decisively in either direction.
Pro Tip: If two lenders quote you rates a quarter-point apart on the same day, that’s not necessarily a red flag. Mortgage pricing depends on each lender’s current pipeline, their risk appetite for your loan profile, and how recently they updated their rate sheet. Always compare at least three quotes on the same day.
A few things explain why your neighbor’s rate and yours might not match, even if you applied the same week:
- Credit score tiers can shift your rate by half a point or more between the top and bottom bands.
- Loan-to-value ratio matters. A 20% down payment typically prices better than 10% down.
- Discount points paid upfront lower your rate but raise your closing costs.
- Loan type (conventional, FHA, VA, jumbo) carries its own pricing curve.
- Rate locks executed on different days will differ even for identical borrower profiles, since Treasury yields move daily.
What Fannie Mae, MBA, and Freddie Mac Project for 2026
The forecasting consensus for 2026 is narrower than you might expect from an industry that spent the last few years getting predictions wrong in both directions. Fannie Mae expects the 30-year fixed to average around 6.4% across 2026, with only a modest step down anticipated once 2027 begins. The Mortgage Bankers Association’s forecast lands just above that, calling for rates near 6.5% through year-end. Freddie Mac doesn’t publish a formal annual forecast the way Fannie Mae and the MBA do, but its weekly PMMS readings have tracked consistently inside that same mid-6% corridor throughout the year, which effectively confirms both projections in real time.
Independent finance publishers largely echo this. Forbes Advisor’s synthesis of forecaster data puts 2026 rates around 6.3% to 6.4% for much of the year, while Bankrate’s forecast is a touch more optimistic, with an average near 6.1% and scenarios that dip as low as 5.7% under favorable conditions. That’s the widest gap among the major forecasters, and it comes down to how much disinflation and Fed rate cuts each model bakes in.
| Forecaster | 2026 Projection (30-Year Fixed) | Timing Note |
|---|---|---|
| Fannie Mae | ~6.4% | Modest decline expected in 2027 |
| MBA | ~6.5% | Holds through end of 2026 |
| Freddie Mac (weekly PMMS) | ~6.65% (Aug 2026 reading) | Real-time confirmation of consensus range |
| Forbes Advisor (synthesis) | ~6.3–6.4% | Small quarterly movement |
| Bankrate | ~6.1% average (range 5.7–6.5%) | More optimistic, condition-dependent |
The takeaway isn’t that one forecaster is right and the others are wrong. It’s that every credible model, even the more bullish one from Bankrate, still lands well above the sub-5% rates many buyers remember from a few years back. That’s the “new normal” this forecast keeps returning to.
What Actually Moves Mortgage Rates
Mortgage rates don’t move because the Federal Reserve says so directly. The Fed sets the federal funds rate, which governs short-term borrowing costs, but 30-year mortgage rates track the 10-year Treasury yield far more closely. Investors price that yield based on where they expect inflation and Fed policy to be years from now, not just this quarter.
Four forces do most of the work behind any given week’s rate move:
- Fed policy signals. Statements from Fed officials about the pace of future cuts move Treasury yields within hours, even before any actual rate change happens.
- The 10-year Treasury yield. Mortgage rates typically run 1.5 to 2 percentage points above the 10-year yield, a gap known as the mortgage spread.
- Inflation data. Monthly CPI reports and Core PCE readings are the single biggest catalyst for sudden rate swings, since they directly shape Fed rate-cut expectations.
- Geopolitical and energy shocks. Oil price spikes or unexpected international conflict can send investors into Treasury bonds for safety, which sometimes pushes yields down, or out of them on inflation fears, which pushes rates up.
Pro Tip: Watch the CPI release calendar more closely than Fed meeting dates. Markets often move more sharply on a surprise inflation print than on an actual Fed decision, since the decision is usually already priced in.
Baseline, Best-Case, and Worst-Case Scenarios for 2026
Three paths are worth planning around, and the gap between them is smaller than headlines sometimes suggest.
- Baseline scenario (most likely): Rates hold in the mid-6% range for most of 2026, consistent with Fannie Mae, the MBA, and Freddie Mac’s weekly readings. This assumes inflation cools gradually without collapsing and the Fed continues a slow, cautious pace of cuts.
- Best-case scenario: A faster-than-expected disinflation trend, combined with a weaker labor market that pushes the Fed toward more aggressive cuts, could bring rates into the low-6% or high-5% range. CBS News reporting notes this would still likely fall short of a sustained drop below 6% within 2026 itself.
- Worst-case scenario: Renewed inflation pressure, a geopolitical shock that disrupts energy markets, or a labor market that runs hotter than expected could push rates back toward 7%, echoing the volatility seen in recent years.
Most forecasters push their more optimistic scenarios into 2027 rather than 2026, largely because inflation has proven stickier than earlier models assumed and the Fed has stayed deliberately cautious about cutting too fast.
What This Means If You’re Buying or Refinancing
A mid-6% rate environment changes the math on both sides of the transaction, and treating 2026 like the low-rate years will cost you real money if you plan around the wrong assumption.
For buyers, the decision usually isn’t “wait for rates to drop” versus “buy now.” It’s whether your target home and market conditions justify locking in today’s rate with a plan to refinance later if rates do soften. On a $900,000 loan, the difference between 6.4% and 6.9% works out to roughly $290 a month, or about $3,500 a year, which is real money but rarely worth passing on the right house over.
For refinancing, the standard rule of thumb still holds: a rate reduction of at least half a point to three-quarters of a point is usually the threshold where the math starts working once you account for closing costs. Run your own numbers with a mortgage payment calculator before committing, since your break-even point depends heavily on how long you plan to stay in the home.
- Lock your rate once you’re under contract rather than floating and hoping for a dip.
- Compare full APRs across lenders, not just the headline rate, since fees vary widely.
- Ask each lender to price out discount points so you can see the real break-even math.
- Get quotes within the same 24 to 48 hour window so you’re comparing apples to apples.
Your Mortgage Rate Action Checklist for 2026
Rather than trying to time a market that even Fannie Mae and the MBA can’t pin to the decimal, build your plan around the range they’ve already published.
- Get preapproved using a mid-6% planning rate, not a best-case number you saw in a headline. It keeps your budget realistic and your offers competitive.
- Set rate alerts with your lender so you know when weekly movement, up or down, actually affects your numbers.
- Align your lock window with your closing timeline. Most locks run 30 to 60 days, so coordinate this with your offer acceptance date, not your house-hunting start date.
- Use rate contingency language carefully. It can protect you in a fast-moving market, but waiving it can make your offer more competitive in multiple-offer situations. Know which trade-off fits your risk tolerance.
- Track the CPI release calendar and Fed statement dates in the weeks around your expected closing, since a surprise print can move your final locked rate if you haven’t locked yet.
Pro Tip: If you’re buying in a market where rate contingencies are common, ask your agent how often sellers in your target neighborhood have actually enforced them in the past year. Local norms vary more than most buyers expect.
For a full walkthrough on preapproval mechanics and timing, the mortgage pre-approval guide breaks down what lenders actually check before issuing that letter.
How This Plays Out Across Santa Clara County
National forecasts are a starting point, not the whole picture, once you’re actually shopping in Cupertino, Sunnyvale, or San Jose. Over eight years and more than $650 million in closed sales across 570-plus transactions, the pattern in Santa Clara County has been consistent: well-priced homes in strong school districts keep drawing multiple offers regardless of where the 30-year rate sits that week. Inventory here has stayed tight enough that rate sensitivity shows up more in buyer urgency than in final sale prices.

When rates spike, serious Silicon Valley buyers tend to move faster rather than pause, since they know competition eases only slightly. When rates dip even a quarter point, showing traffic picks up almost immediately. Structuring an offer around this rhythm, rather than around a rate you’re hoping to see, tends to produce better outcomes than waiting on the sidelines. The Santa Clara County housing market guide breaks down current inventory trends by neighborhood in more detail.
Primary Sources to Track Through 2026
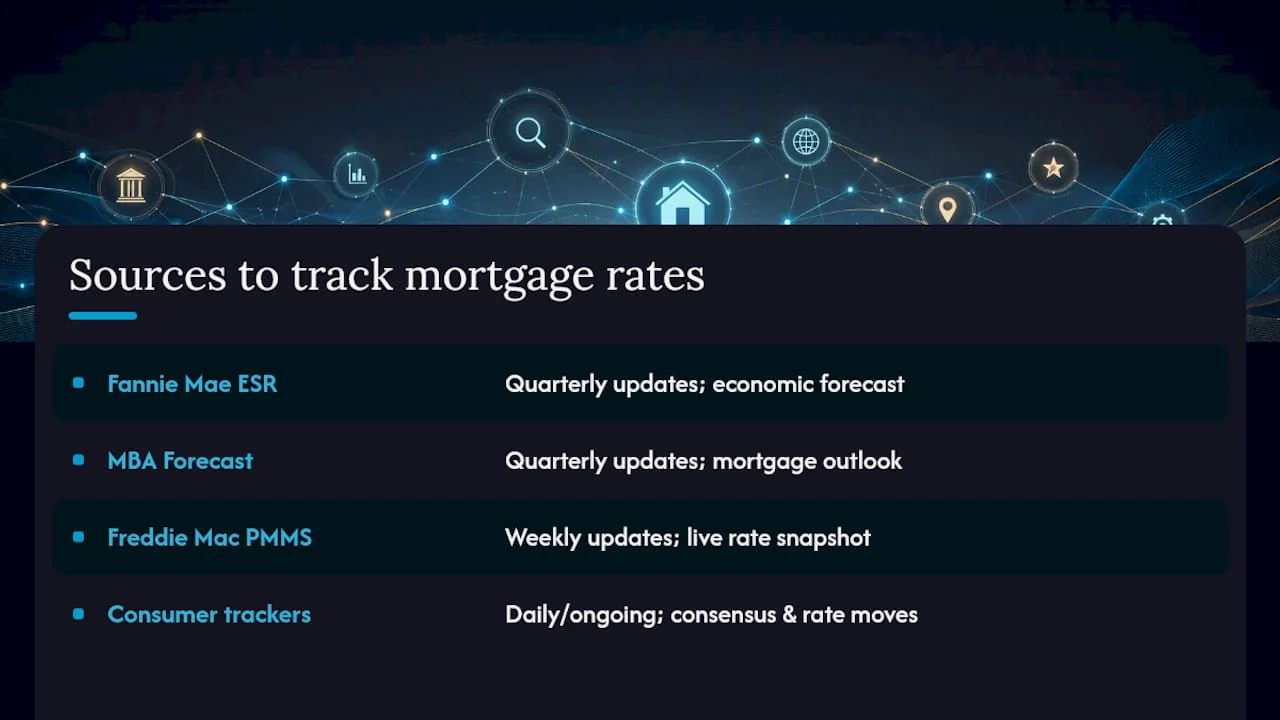
For readers who want to follow this forecast in real time rather than take any single article’s word for it, four sources do the heavy lifting. Fannie Mae’s Economic and Strategic Research forecast and the MBA’s Mortgage Finance Forecast publish updated quarterly projections. Freddie Mac’s PMMS updates weekly and is the fastest way to check where actual rates sit right now. For broader synthesis and consumer-facing analysis, Forbes Advisor and Bankrate both track forecaster consensus closely, and the 1st Mortgage blog on live rate behavior is a useful companion read for understanding how quoted rates shift day to day.
Ready to Turn This Forecast Into a Plan?
A mortgage rate forecast only matters once it shapes an actual offer strategy. If you’re weighing whether to buy now in Santa Clara County or wait out a possible dip, that decision depends as much on local inventory and competition as it does on the national rate outlook. Laxmitoprealtor works with Bay Area buyers to translate forecasts like this one into a concrete plan, from preapproval through closing. Explore buyer representation in San Jose to start building a strategy around where rates actually stand today, not where you wish they were.
The Editorial Take: Stop Waiting for a Number That Isn’t Coming
The forecasting data doesn’t support that.
What gets overrated in most coverage is the rate itself, treated like the only variable that matters. What gets underrated is timing your purchase around local competition and inventory, which in a market like Santa Clara County often swings your final price more than a quarter-point rate move ever will. The buyers who did best over the past year weren’t the ones who guessed correctly on Fed policy. They were the ones who got preapproved at a realistic rate, stayed ready to move on the right property, and treated refinancing as a future option rather than a reason to sit out today’s market.
This article is general information, not a substitute for advice from a qualified financial advisor. Consult a qualified financial professional about your own circumstances before acting on anything here.
Sources
- Fannie Mae forecast and companion materials
- MBA Mortgage Finance Forecast (Jul 2026)
- Freddie Mac PMMS weekly mortgage rates
Recommended
- Santa Clara County Housing Market: 2026 Guide
- Mortgage Payment Calculator – Laxmi Penupothula
- Bay Area Real Estate Market Insights 2026 – Laxmi Penupothula
- Sunnyvale Housing Market: 2026 Trends and Prices

Laxmi Penupothula
Top 1% Realtor SCCAOR, RealTrends Verified (2021–2025) • CA DRE #02047105
SCCAOR Top 1% Santa Clara County • Intero Chairman Circle 2023–2025 • \$650M+ Closed • 570+ Transactions
Silicon Valley & Bay Area Specialist — Cupertino, San Jose, Fremont, Milpitas, Sunnyvale & surrounding cities.
Get a Free Home Valuation →